RADAR: Relative Angular Divergence Across Representations

1Dartmouth College
*Equal contribution
Preprint, May 2026
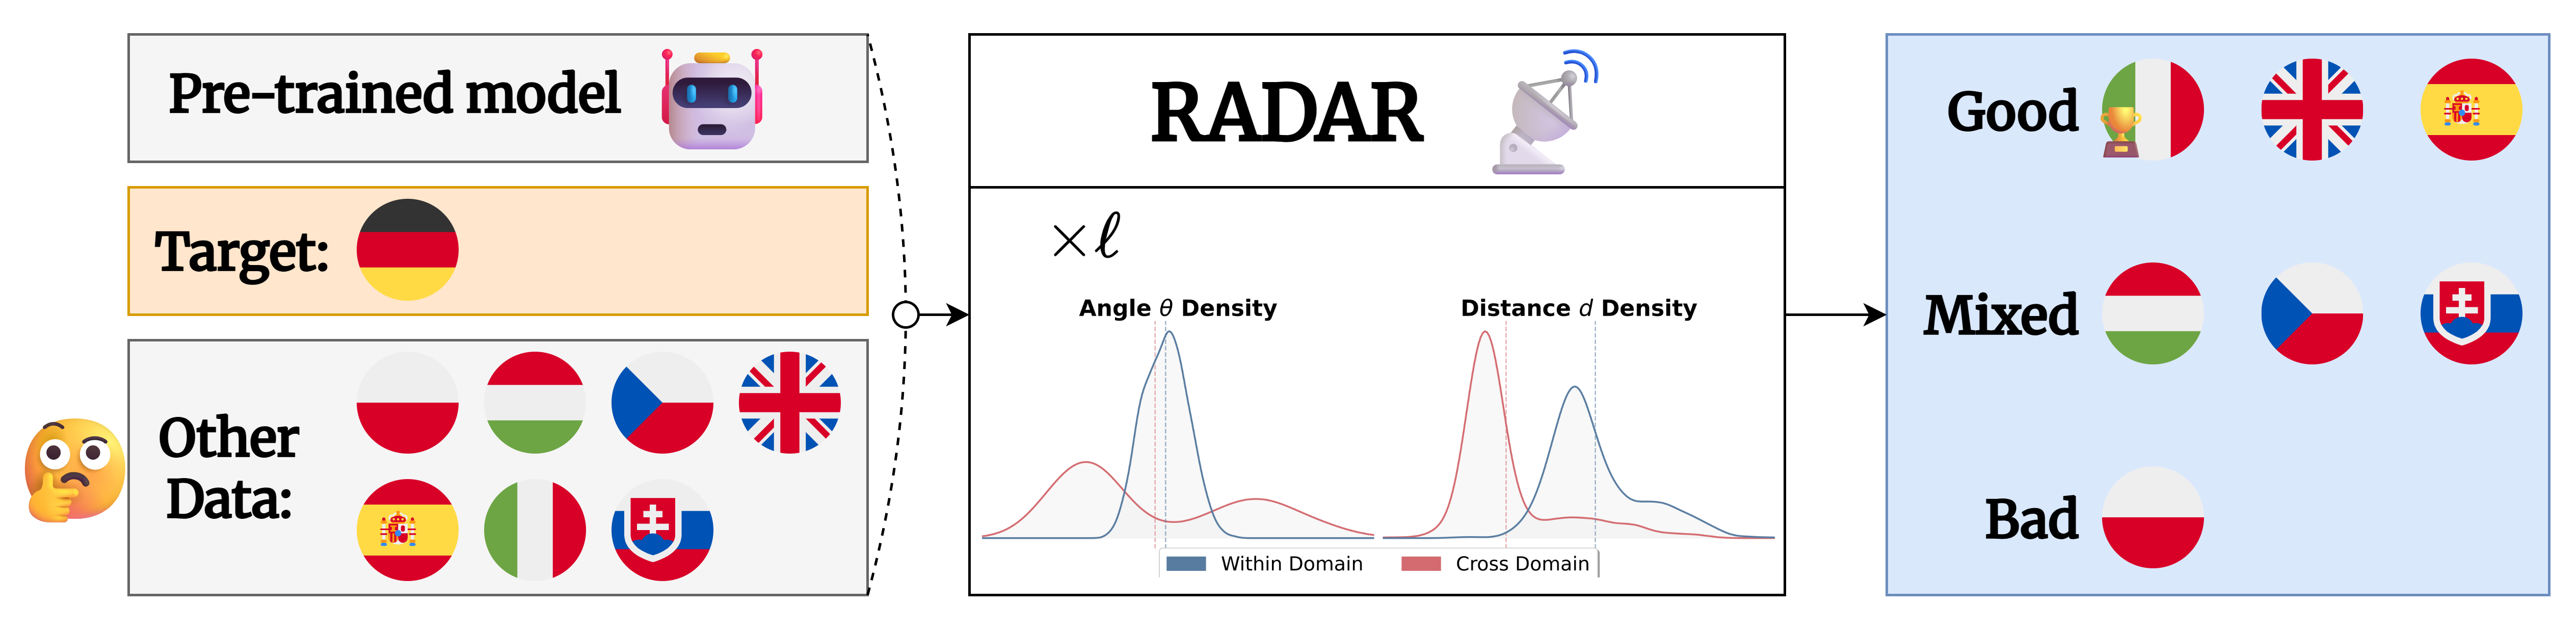
RADAR framework overview: a pre-trained model embeds target and source domains; RADAR compares within- and cross-domain angle and distance densities across layers to flag Good, Mixed, and Bad source candidates.

Picking which source data to use is a guessing game — and a wrong guess can hurt the target task!
RADAR reads the layer-wise geometry of frozen foundation models — angles θ and relative distances d between sample trajectories — to rank candidate sources without any fine-tuning.

Abstract

Machine learning methods rely on data. However, gathering suitable data can be challenging due to availability constraints, cost, or the need for domain expertise. Expanding datasets with additional sources is a common response to limited data, yet this practice does not always improve downstream performance and can sometimes lead to a loss of performance, known as negative transfer.

We propose RADAR, a simple, geometrically grounded metric for estimating cross-domain transferability in foundation models. RADAR analyzes the layer-wise evolution of representations by measuring angular alignments and relative changes in distance along layer-to-layer displacement trajectories, and by comparing empirical distributions of within-domain and cross-domain dynamics. We hypothesize that domain transferability is related to the divergence between these trajectory distributions.

We evaluate the metric across multiple modalities, including cross-lingual sentiment classification with text embedding models and cross-domain image classification with foundation vision models. Across several settings, RADAR provides competitive predictive performance relative to existing transferability metrics on several vision and text benchmarks, with particularly strong results when domain transitions are smooth or cleanly separated. Our ablations further suggest that the effectiveness of transferability estimation depends on the geometry of the model's internal representation space, with different modalities favoring different topological formulations.

The Source Selection Problem

Suppose you have a target domain — say, real photographs — and a pool of candidate source domains (paintings, sketches, clipart, …). Which blend should you train on?

With K candidates, there are 2K-1 possible blends. Evaluating each empirically requires a full retraining run, which is infeasible at any reasonable scale. We need a metric that predicts the transfer gain Δ(S) — ideally from frozen features alone, with no retraining at all — and whose ranking is consistent with the ranking induced by true downstream accuracy.

We evaluate any candidate metric by its Spearman rank correlation ρ with ground-truth transfer gains across all blend configurations.

Layer-wise Geometric Trajectories

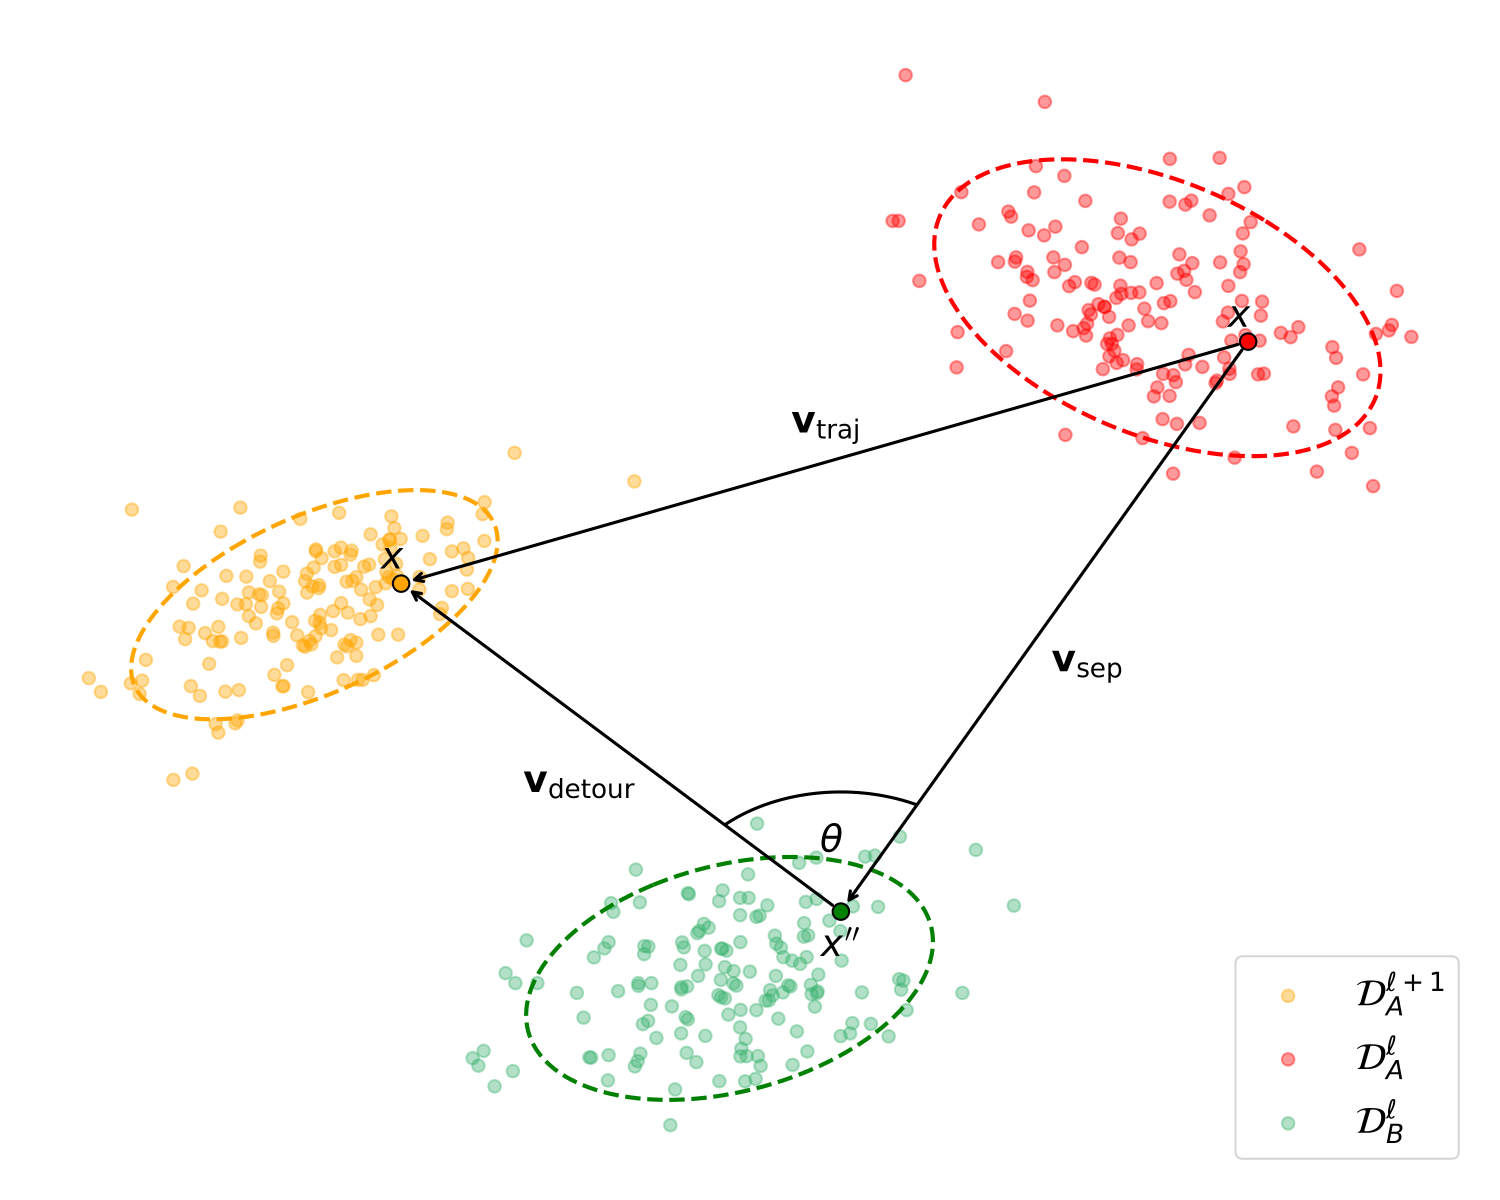
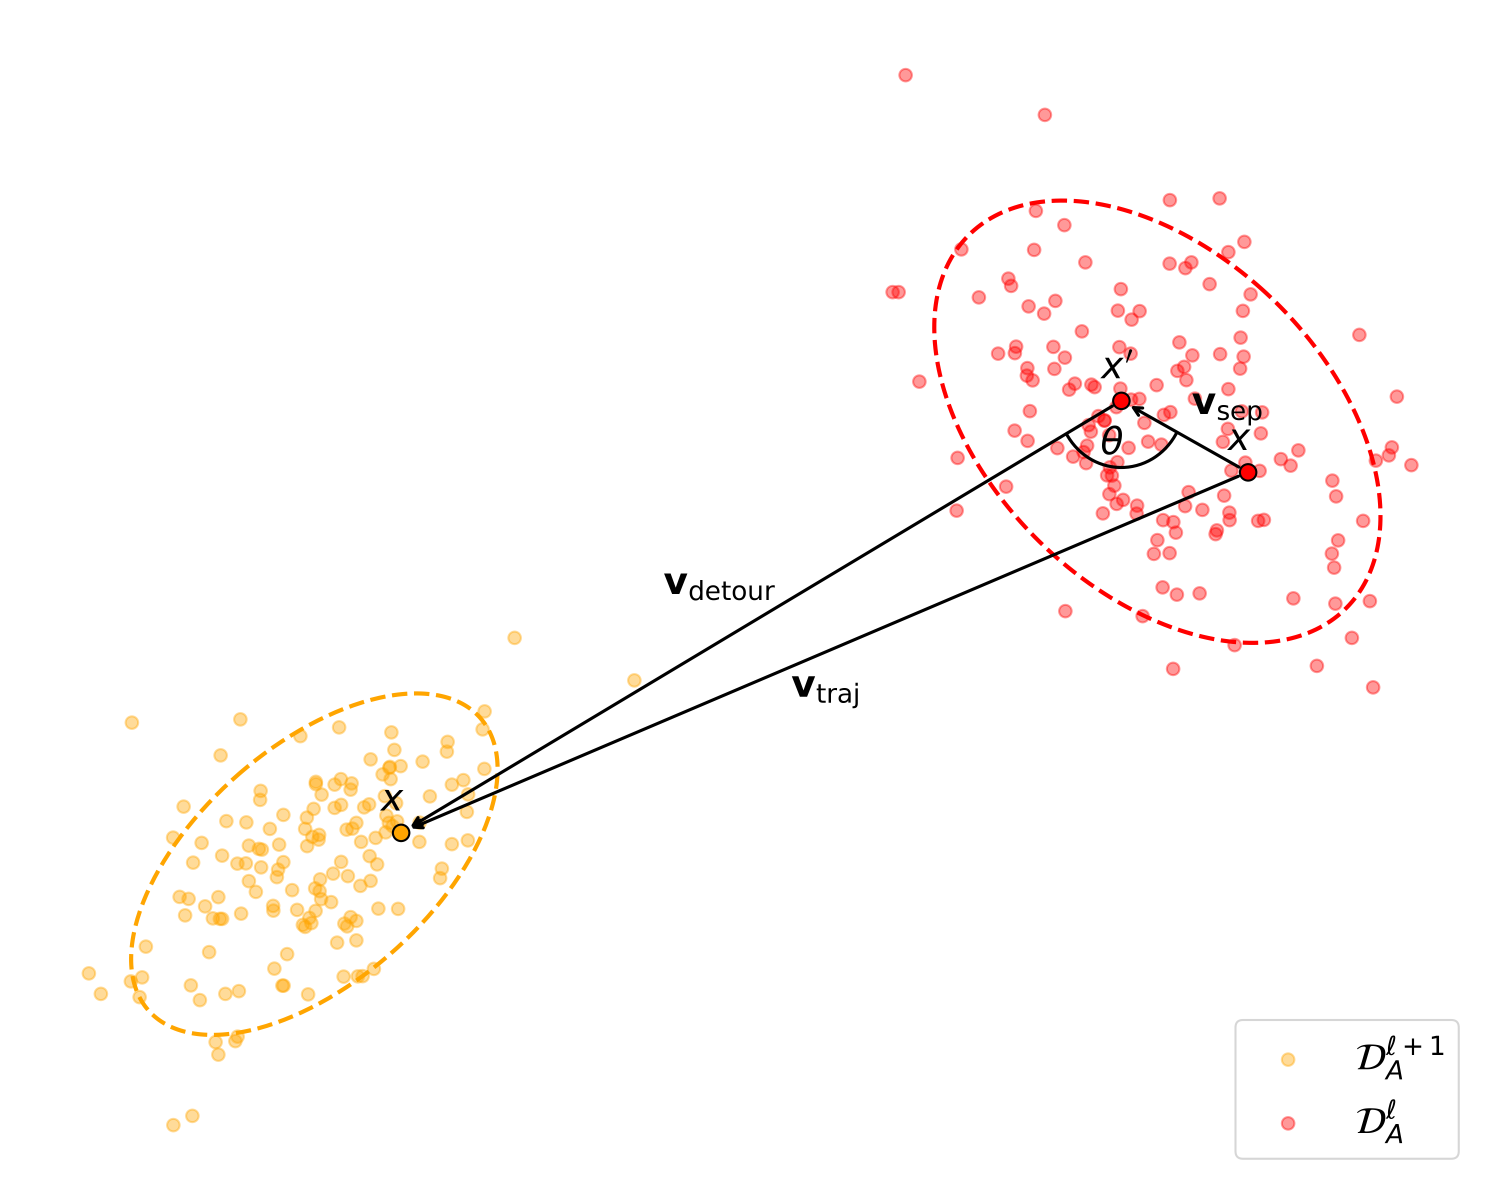
For an anchor sample x in domain DA, we draw an intra-domain partner x' and a cross-domain partner x'' from DB. At every layer transition ll+1, we form a triangle of displacement vectors:

  • vsep — the spatial separation between the two samples at layer l.
  • vdetour — the path from the partner at l to the anchor at l+1.
  • vtraj — the anchor's direct trajectory from l to l+1.
...

(a) Within-domain dynamic.

...

(b) Across-domain dynamic.

Within-domain (left) vs. across-domain (right) dynamics. Per the triangle closure identity (proved in the appendix), vsep + vdetour = vtraj, so the relative distance d measures the normalized excess path length of the detour, and the angle θ quantifies the misalignment between separation and trajectory.
From Trajectories to Divergence

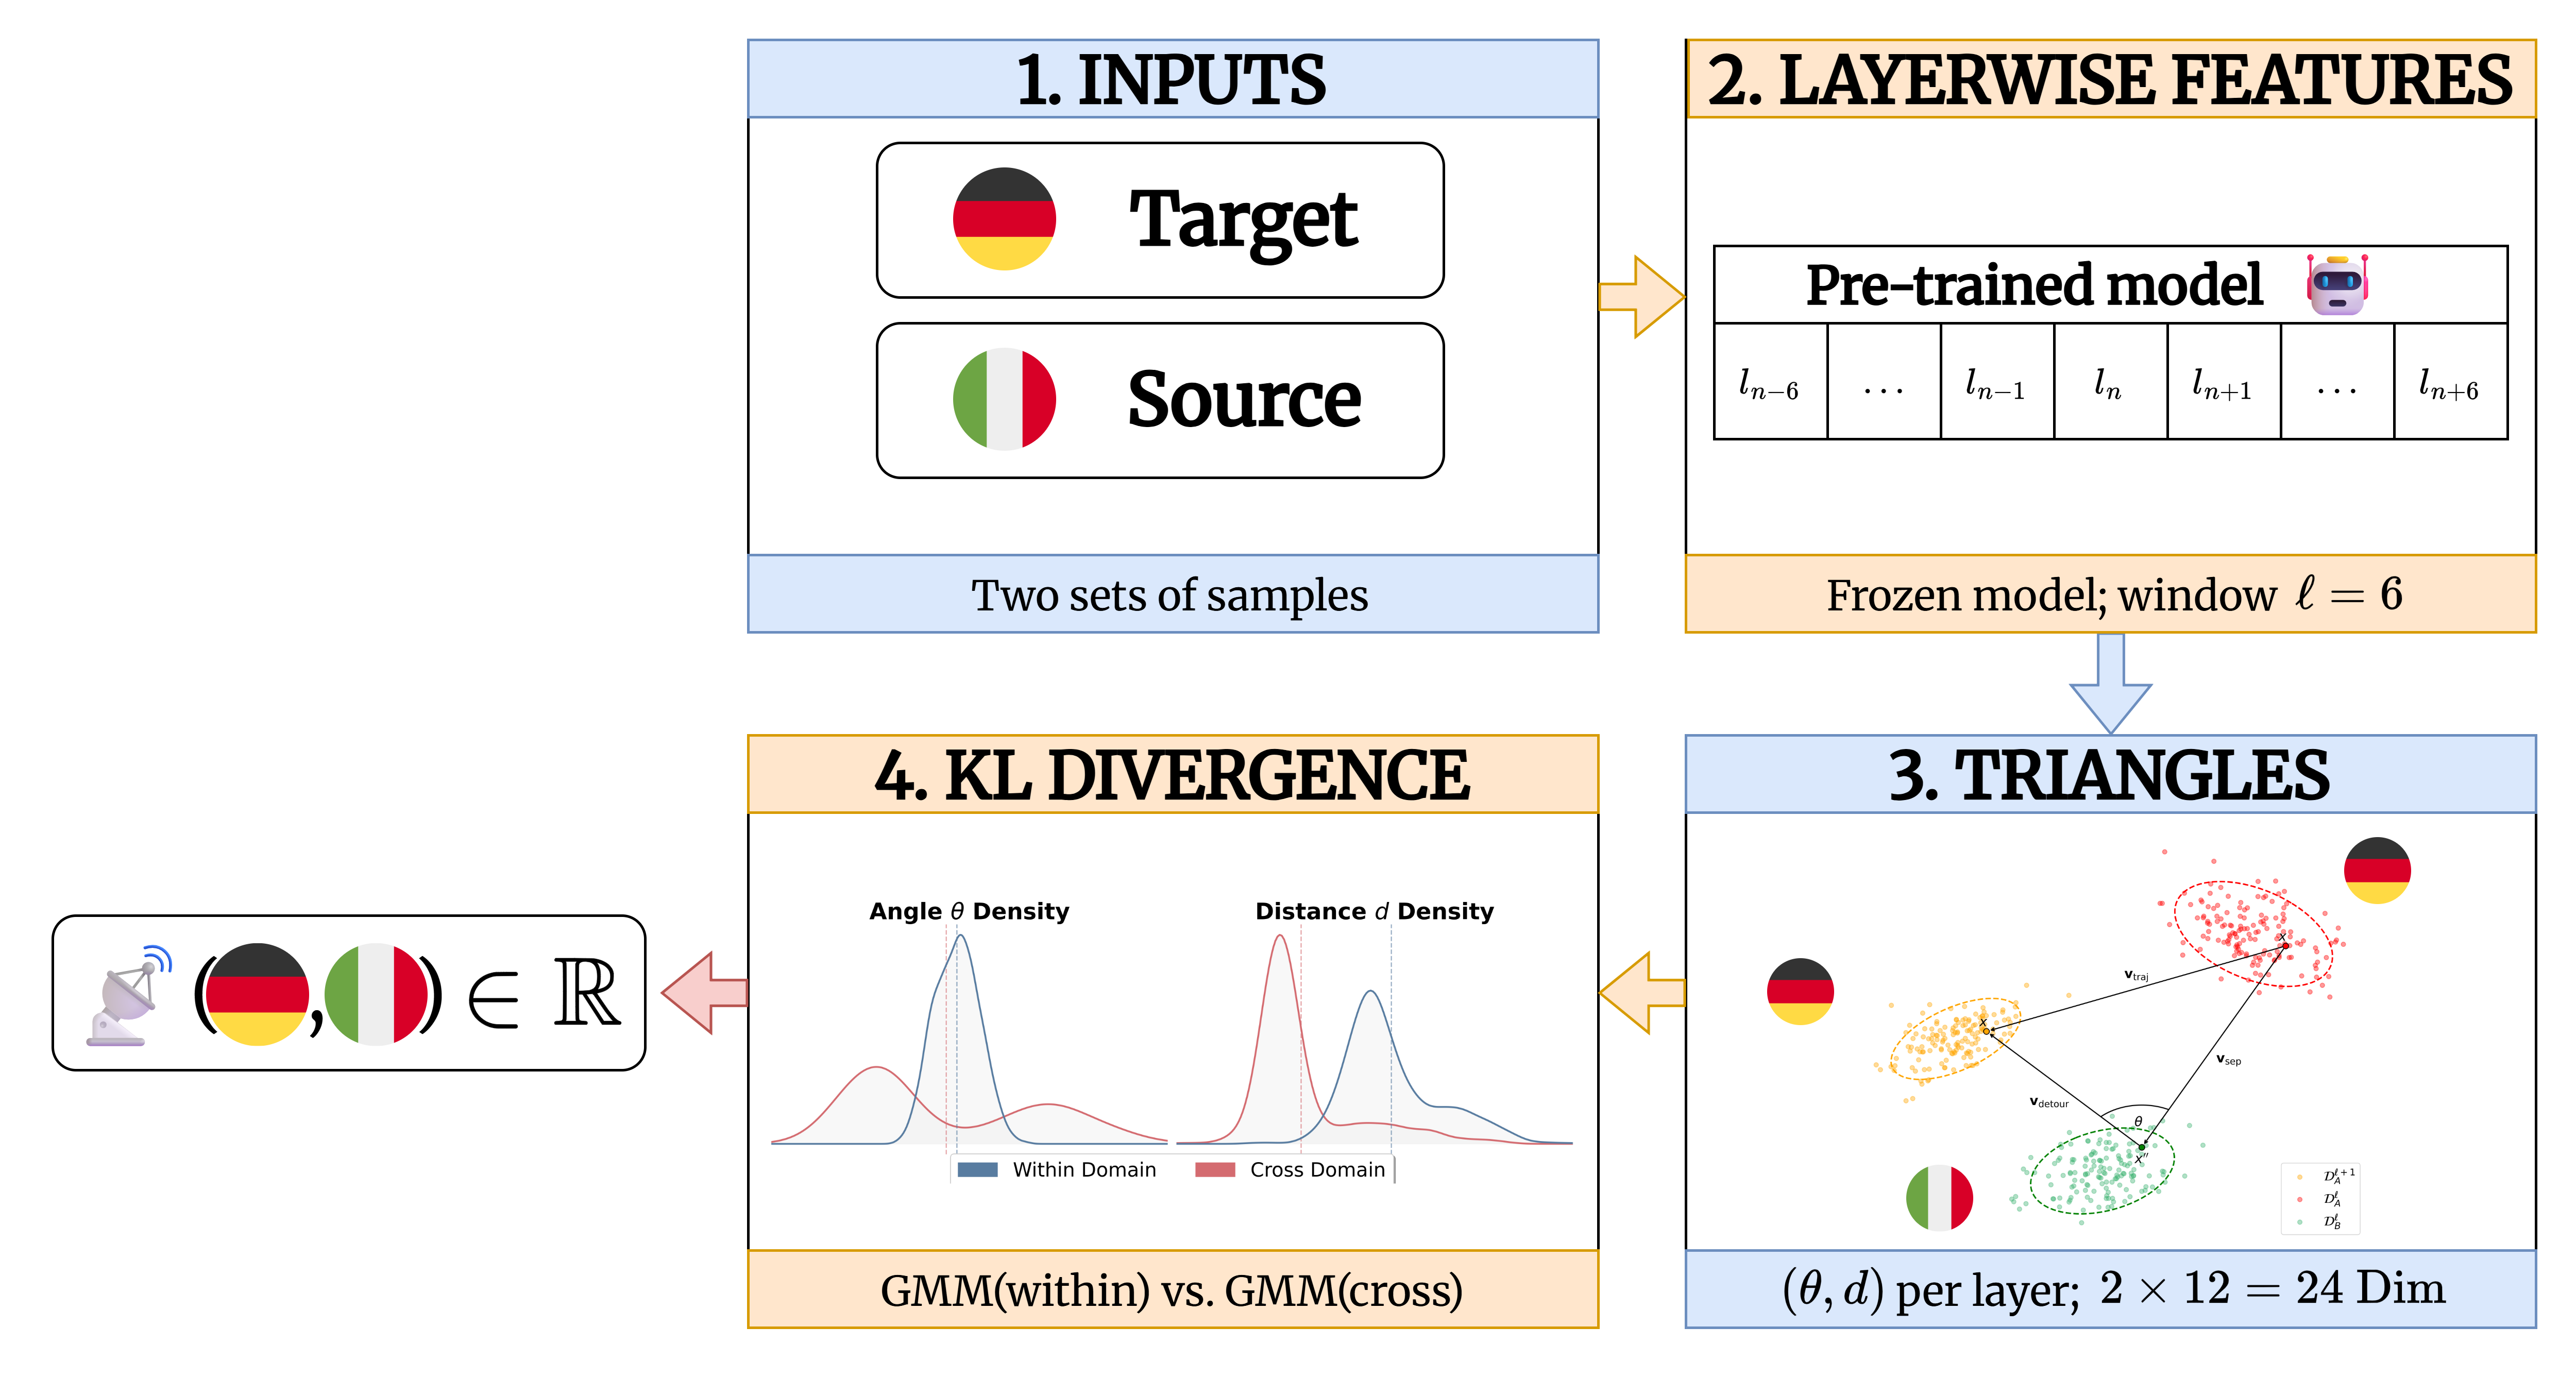
Four lightweight steps, no retraining, no labels needed beyond stratification:

  • Trace — for each pair, collect (θ, d) at every layer transition across a window of radius = 6 (a 24-D feature vector per pair).
  • Sample — mix inlier-inlier and inlier-outlier pairs via distance-weighted stratified sampling to cover both cluster cores and class boundaries.
  • Fit — learn a Gaussian Mixture Model on the within-domain trajectories and a second on the cross-domain trajectories.
  • Diverge — rank candidate sources by the weighted symmetric KL divergence between the two GMMs.
Pipeline figure showing the RADAR steps: extract layer-wise representations, sample inlier and boundary pairs, compute angles and distances over a 13-layer window, fit GMMs, and compute symmetric KL divergence.

The RADAR pipeline. GMM + KL is the only divergence we tested that is universally robust across vision and text; Sinkhorn divergence is highly competitive on text alone.

Results

We evaluate RADAR against seven established transferability metrics — LEEP, H-Score, Reg. H-Score, LogME, NCE, TransRate, and S-OTDD — across two vision backbones (CLIP, DINOv3) and two text-embedding backbones (Qwen3-Embedding, EmbeddingGemma), spanning five benchmarks. We report Mean Correlation Improvement (MCI) over a centroid-distance baseline: lower is better.

RADAR achieves top-three performance in 7 of 10 configurations and the absolute best in 6 of them.

How to read the tables below. MCI is the difference in Spearman rank correlation between the evaluated metric and the centroid-distance baseline. Negative (lower) is better. Bold = best, underline = second-best.

Vision benchmarks

Method DomainNet OfficeHome PACS
CLIPDINOv3 CLIPDINOv3 CLIPDINOv3
LEEP −8.63 3.44 −4.52 3.92 −14.64 −33.67
H-Score 0.92 19.13 8.77 21.98 −10.28 −50.29
Reg. H-Score 6.03 17.11 8.13 26.95 −12.11 −48.89
LogME 12.17 19.90 −4.41 18.67 −9.96 −72.08
NCE −4.88 4.15 −7.20 3.93 −13.61 −33.89
TransRate 2.29 12.71 −11.78 −3.12 −25.45 −27.38
S-OTDD 27.01 21.31 10.88 −24.69 −23.92 −37.50
RADAR (Ours) −9.71 −9.87 −16.62 3.55 −0.27* −30.23*

Vision results. RADAR is the only metric to achieve negative MCI on DomainNet for DINOv3, and tops the OfficeHome–CLIP setting. *On PACS, results are mixed — the dataset sits in an intermediate domain-separation regime where trajectory descriptors are less informative (see the geometry discussion below).

Text benchmarks

Method EuroEval Amazon Reviews
Qwen3-Emb.EmbeddingGemma Qwen3-Emb.EmbeddingGemma
LEEP −3.58 3.94 1.76 1.91
H-Score 9.27 11.75 −6.84 3.35
Reg. H-Score 6.13 10.45 −6.91 3.35
LogME 22.93 20.82 22.57 20.91
NCE −0.02 1.88 −7.60 5.71
TransRate 3.12 4.10 12.47 19.48
S-OTDD 6.19 18.71 15.63 19.69
RADAR (Ours) −7.13 −30.58 3.21 1.23

Text results. On EuroEval / EmbeddingGemma, RADAR beats the next-best baseline by over 30 percentage points. Metrics that did well on vision — LogME, TransRate, S-OTDD — collapse on text; RADAR is the only metric that transfers cleanly across modalities.

Click for the ImageNet-C robustness story.

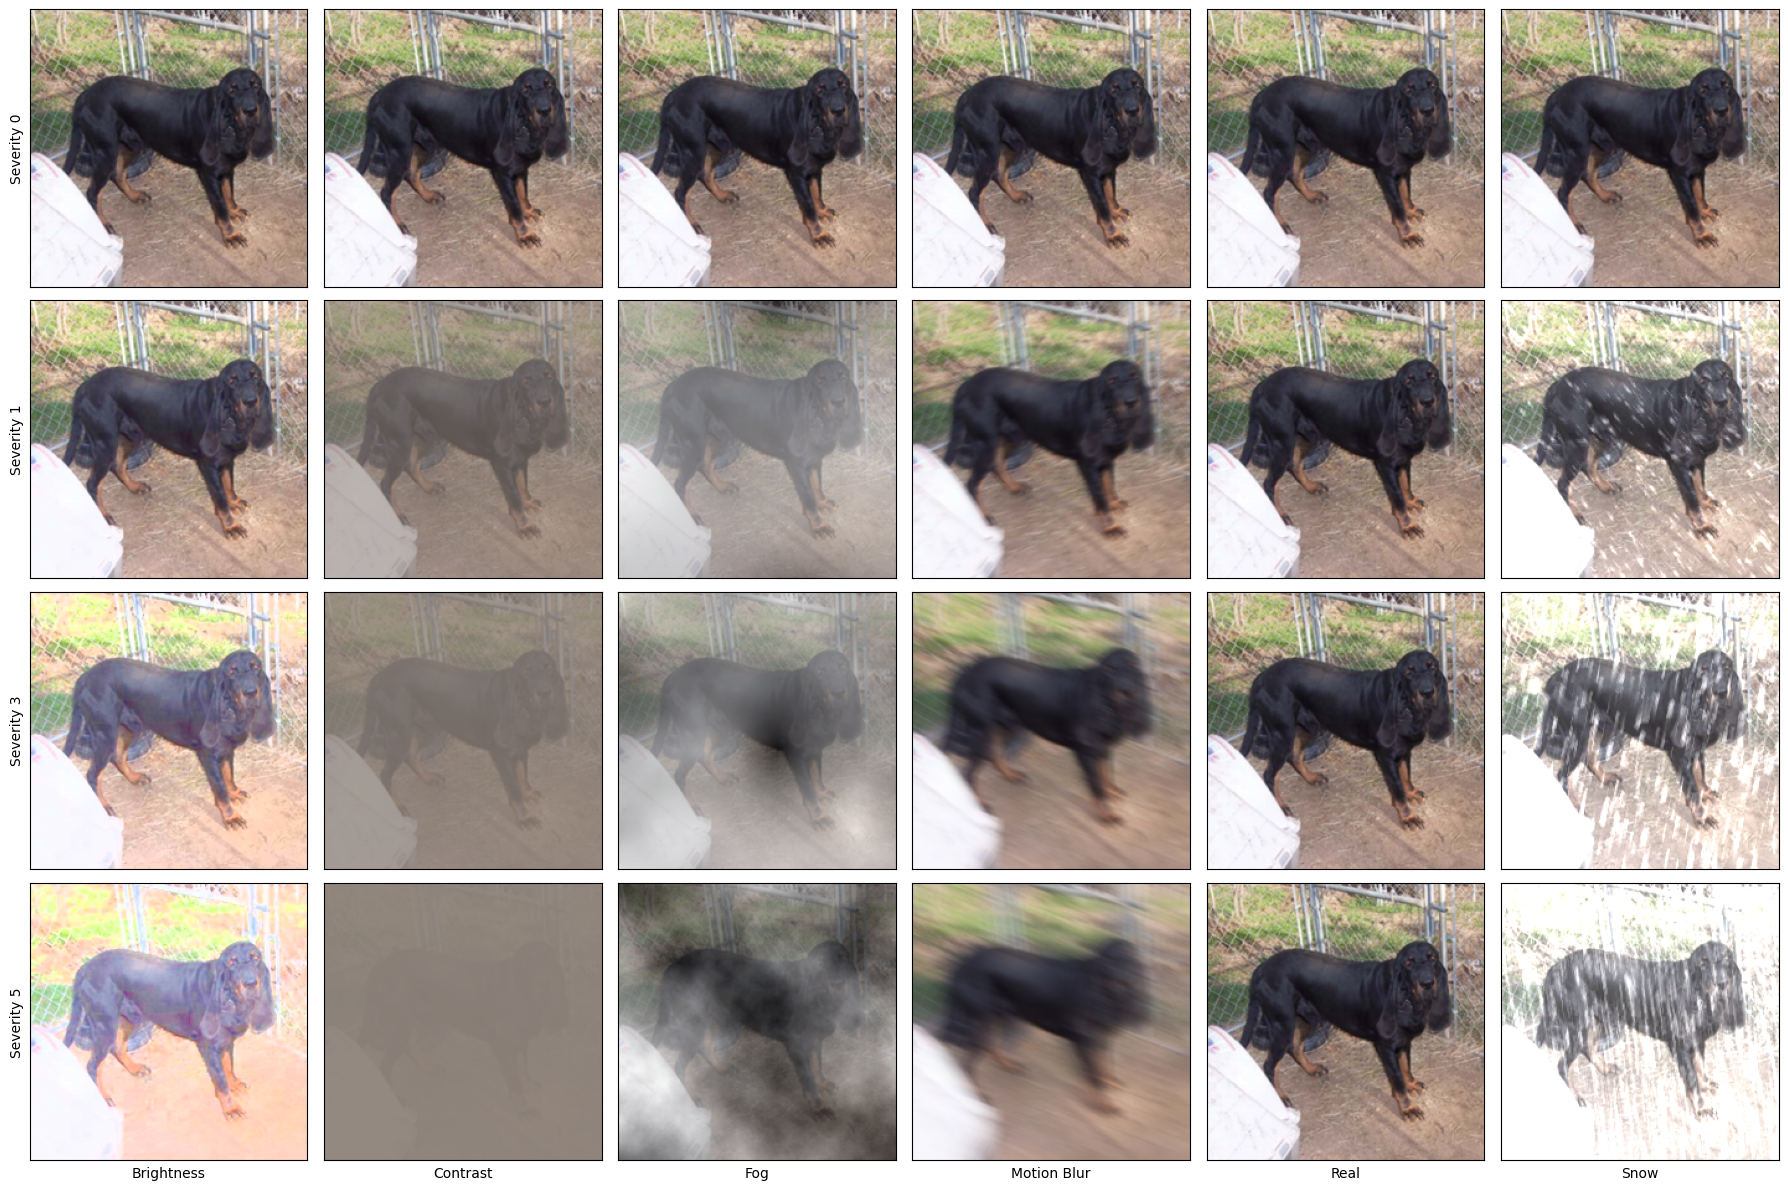
On ImageNet-C, RADAR's behavior follows a structural pattern. Under low corruption (Severity 1) it is competitive with the strongest statistical baselines; under extreme corruption (Severity 5) it dominates — achieving an MCI of −30.16 on DINOv3 while metrics like LEEP and NCE blow past 35.0. Under moderate corruption (Severity 3), trajectory alignments are perturbed without being uniformly distorted, and the metric degrades.

This is also exactly why PACS is hard for RADAR: its Layer 0 inter-domain distances mirror ImageNet-C Severity 3 — an intermediate regime that is neither smooth enough for trajectory alignment nor distinct enough for clean separation. The diagnostic is available in advance from input-layer centroid distances alone, which makes RADAR's scope checkable before you commit to the metric.

Visualization of ImageNet-C synthetic corruptions across severities 0, 1, 3, and 5, illustrating progressive structural degradation.

ImageNet-C corruptions. Progressive structural degradation across severities. RADAR tracks the chaotic geometric trajectories at Severity 5 where most static metrics collapse.


Crucially, RADAR is also efficient. On CPU alone it is the fastest of all evaluated metrics (645s vs. LEEP's 895s and LogME's 2804s on DomainNet); a Sinkhorn-based variant brings GPU runtimes in line with the fastest baselines while preserving most of the predictive power.

Three Findings from the Ablations

We ran the metric through extensive ablations — on feature choice, sampling strategy, topological space, GMM covariance, divergence algorithm, and three hyperparameters. Three results stand out:

  • Angles and distances are complementary. Removing either one degrades performance for both modalities; text in particular relies heavily on angular alignment — consistent with the cosine-based contrastive objectives used to train modern text encoders.
  • Modalities prefer different geometries. Text representations live on a Euclidean manifold for the purposes of this metric — projecting them into a geodesic or pseudo-Cartesian space severely degrades the correlation. Vision models are more flexible: DINOv3 actually benefits from a pseudo-Cartesian projection, while CLIP, like the text models, prefers Euclidean. We adopt Euclidean as the unified default.
  • The data-processing inequality justifies looking past the final layer. We prove (Appendix J) that the total-variation divergence between domains is monotonically non-increasing across deterministic layer maps — so single-layer, final-output metrics systematically underestimate domain divergence. RADAR spans a window of 13 layers around the chosen depth to recover that signal.

Several lines of work informed RADAR. We invite you to read them too.

BibTeX

@article{cadet2026radar,
  author    = {Cadet, Xavier and Nowak, Mateusz and Chin, Peter},
  title     = {{RADAR}: Relative Angular Divergence Across Representations},
  journal   = {arXiv preprint arXiv:2605.23028},
  year      = {2026},
}

Acknowledgments

This research was funded by the Defense Advanced Research Projects Agency (DARPA), under contract W912CG23C0031.